Candid Landscapes Tool Visualizes Philanthropic Funding Flows Across New York City
Candid has released Landscapes, an interactive visualization layer for grants and philanthropic data.
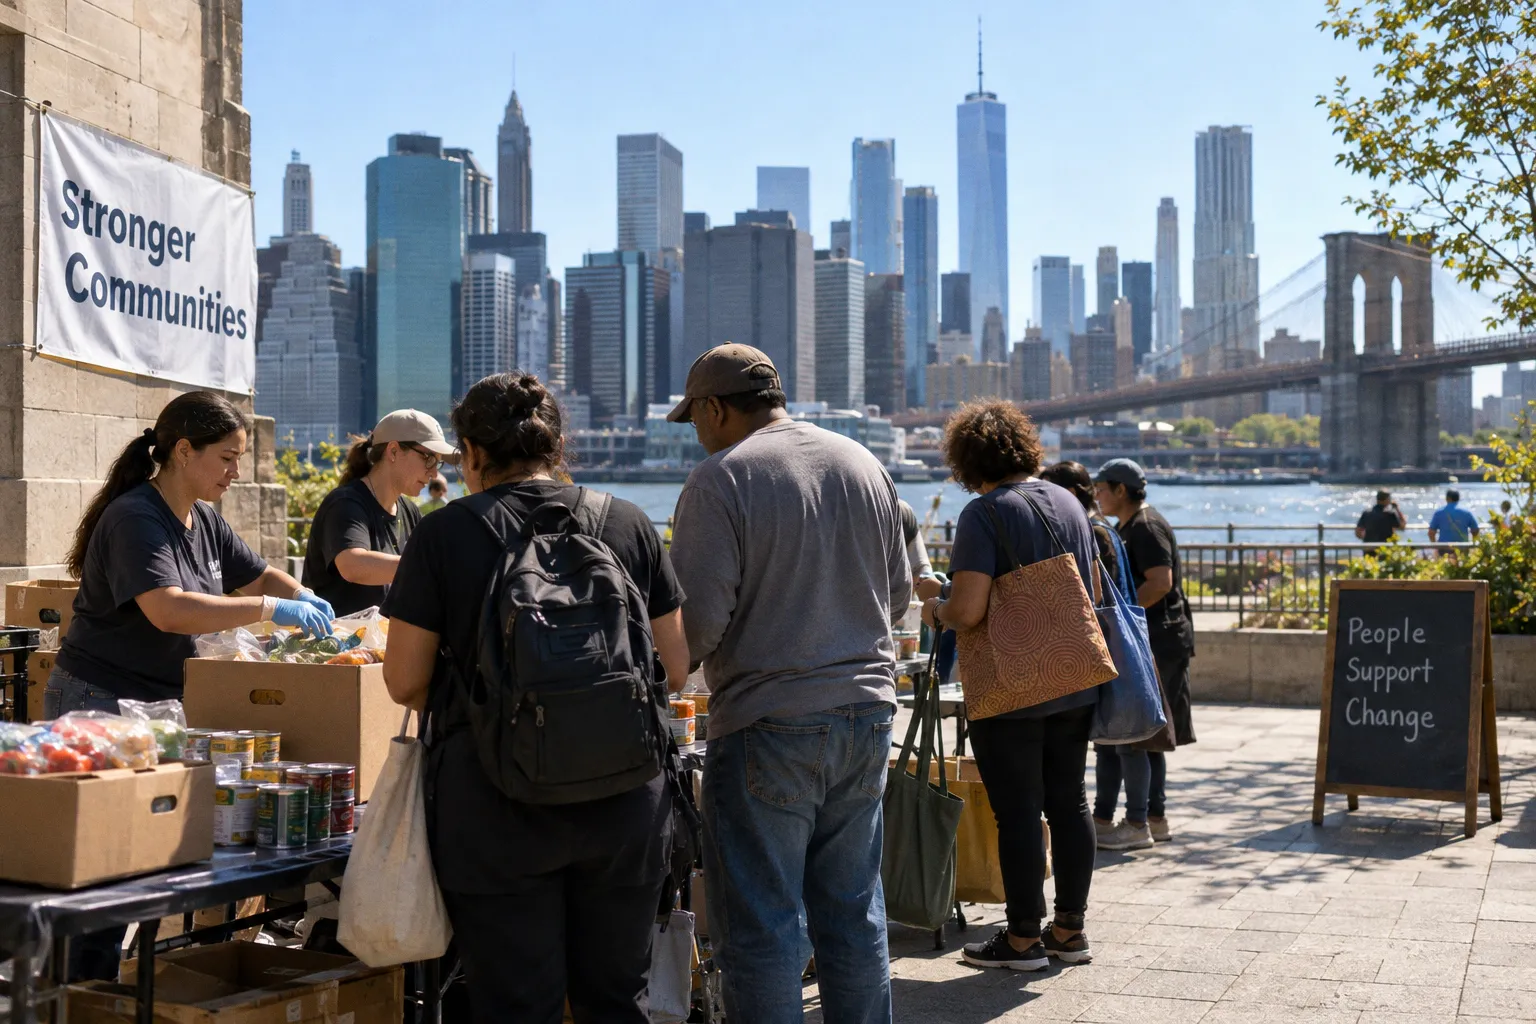
According to the organization, the tool maps giving flows, recipient demographics, and funding patterns by geography across its grants database. For New York City nonprofits, the release adds a new analytical lens on capital movement across boroughs, subsectors, and recipient profiles in one of the most contested philanthropic markets in the country.
Data scope
Landscapes sits inside Candid's research infrastructure and draws on the organization's grants database. The interface organizes flows along three dimensions: who is giving, who is receiving, and where dollars are concentrating. Recipients can be filtered by demographic attributes, organizational type, and programmatic area. Geography is treated as a first-class axis, permitting cuts at city, borough, and ZIP-code level.
For a sector analyst, the utility sits in layering. Two queries on the same dashboard can produce a side-by-side comparison of foundation giving to, say, youth services in the Bronx versus workforce development in Brooklyn, with demographic overlays attached to recipient profiles. Cross-subsector queries run within the same session without requiring separate exports.
What NYC operators should check
The release is positioned as a research instrument, not a fundraising platform. Several operational use cases warrant immediate testing.
- Funding concentration. Query recipients in New York County and Kings County. Identify the top fifteen grantmakers by total dollars and check overlap against your existing portfolio. Duplication signals either redundancy in coverage or an opportunity to consolidate reporting.
- Demographic alignment. Filter recipients by the demographic attributes the tool surfaces. Compare your beneficiary profile against the recipients most heavily funded by foundations you have not yet approached. Variance above fifteen percent on any single attribute is worth investigating.
- Subsector gaps. Pull the funding-by-cause distribution for the five boroughs. Identify subsectors where recipient volume is high but dollar concentration is low, and vice versa. The first pattern indicates donor saturation; the second indicates unmet capital demand.
- Peer benchmarking. Locate three to five peer organizations of comparable budget size. Compare their funder mix against yours. Material variance on any single source category is a signal worth documenting before the next board cycle.
Limitations worth noting
Landscapes depends on Candid's grants database, which captures reported giving rather than total philanthropy. Private foundation giving, donor-advised fund disbursements at scale, and individual major gifts are undercounted relative to public 990 filings. Treat the tool as a map of visible funding terrain, not the full landscape. Caveats on demographic attribution apply wherever recipient self-reporting is incomplete, and that is the case for a meaningful share of smaller NYC 501(c)(3)s.
For organizations building prospect lists, the tool reduces manual desk research on foundation activity by an order of magnitude. For grantees monitoring peer funding, it provides a structured alternative to anecdote. Watch for clarification in the next release cycle on whether the visualization layer supports API access for integration with internal CRM systems.